Reports
Access business analytics through General Reports and Shift Reports. Monitor production volumes, sales revenue, inventory turnover, and daily operational data.
General Report
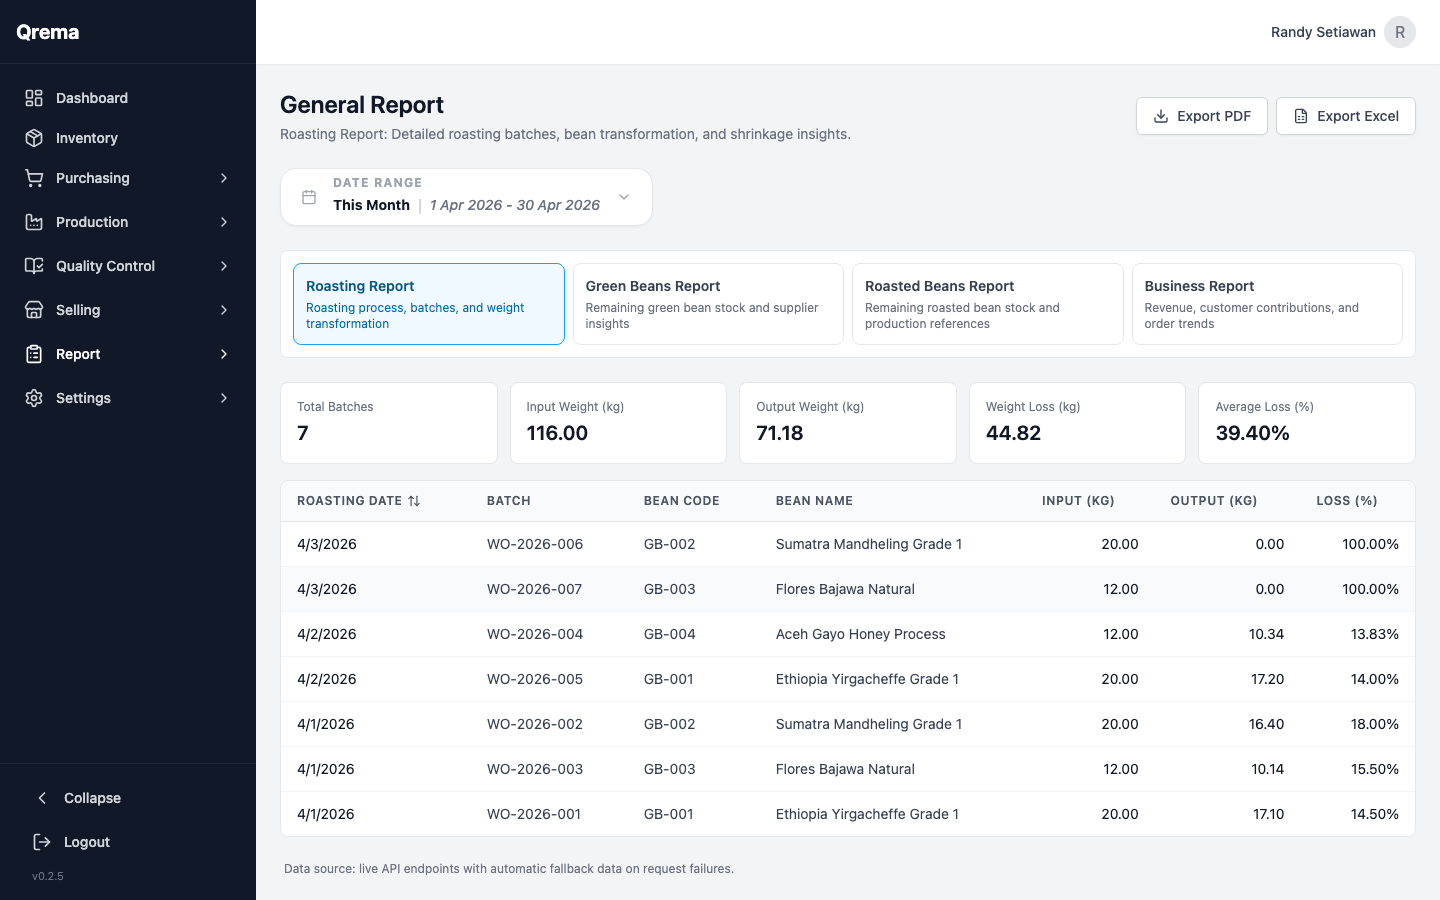
The General Report provides a comprehensive overview of your roastery's performance across all modules.

Available Metrics
| Metric | Description |
|---|---|
| Production Volume | Total kg of coffee roasted in the selected period |
| Roast Loss Average | Average weight loss percentage across all roasts |
| Sales Revenue | Total revenue from sales orders |
| Purchase Costs | Total spent on green bean purchases |
| Inventory Value | Current total value of all inventory |
| Orders Fulfilled | Number of sales orders delivered |
Filters

- Date Range -- Select start and end dates to scope the report
- Category -- Filter by specific modules (Production, Sales, Purchasing)
Tip: Use the General Report for monthly business reviews. Set the date range to the previous month to get a complete picture of operations.
Report Charts
The report includes visual charts for quick analysis of trends.
Shift Report (Open/Close)
The Shift Report tracks daily operational data for each work shift -- what was roasted, sold, and any notes from the team.
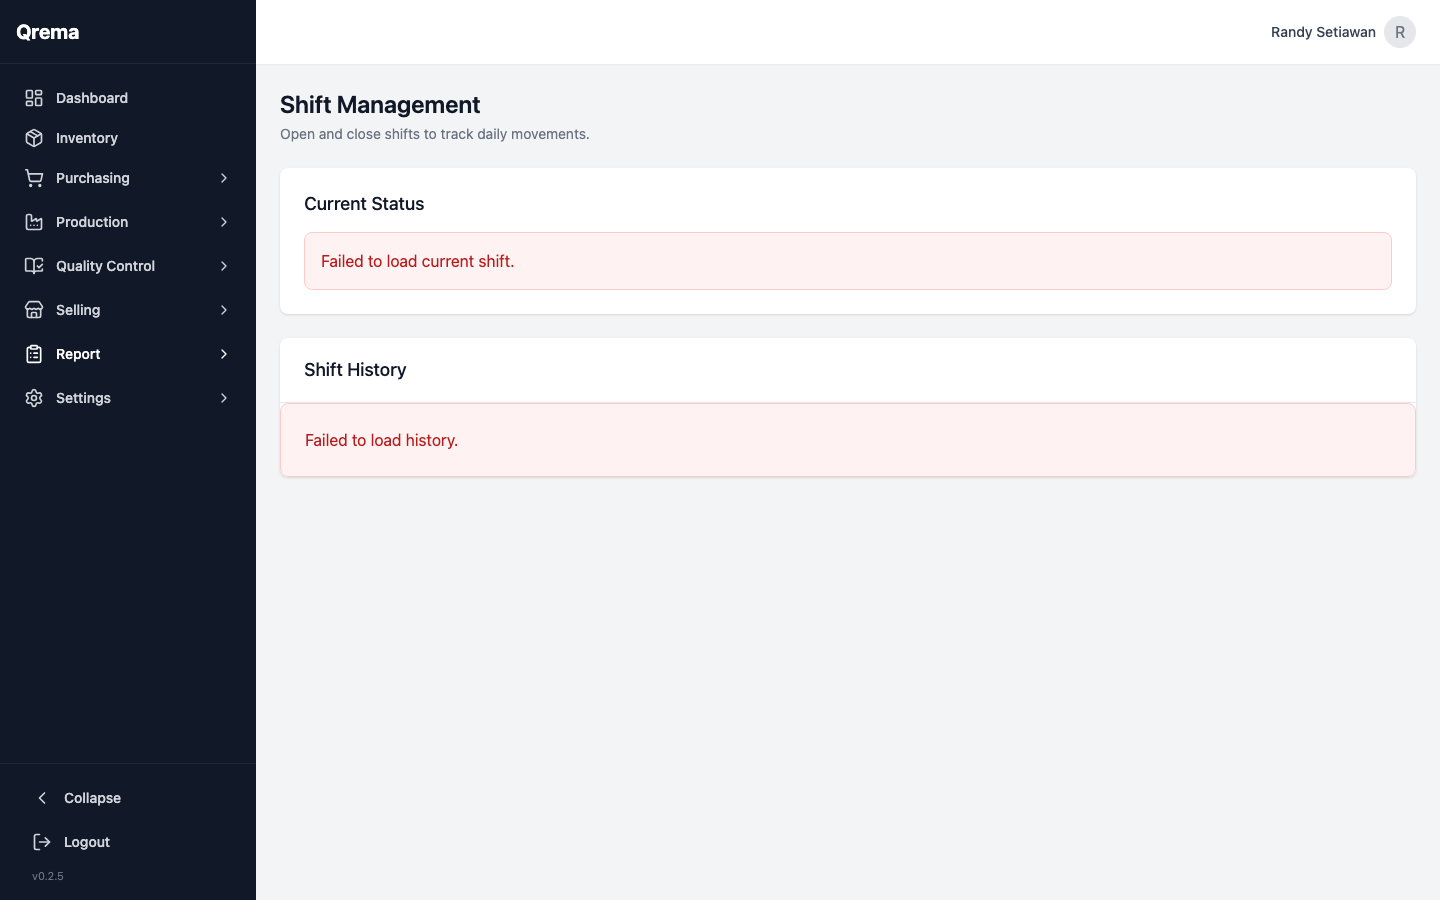
Shift Data
- Shift Date -- The date of the shift
- Opened By -- Who opened the shift
- Closed By -- Who closed the shift
- Production Summary -- What was roasted during the shift
- Sales Summary -- Orders processed during the shift
- Notes -- Operational notes, issues, or handoff messages
Use Case: Shift reports are ideal for roasteries with multiple shifts or operators. The closing operator records what was done, and the opening operator of the next shift can review it.
Video Walkthrough
Reports -- navigating general and shift reports